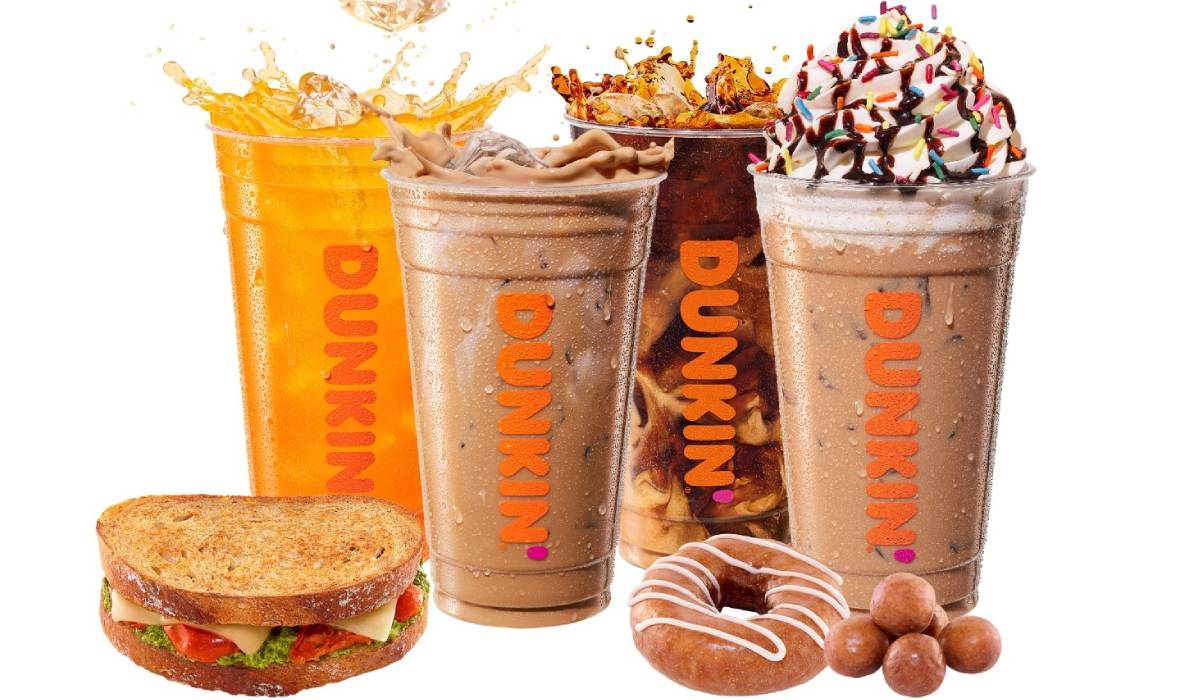
Few restaurant categories have taken the twisting journey coffee has over the past couple of years. Habitual customers stopped traveling and left routines behind in 2019. It forced brands like Starbucks and Dunkin’ to work toward new daypart definitions. What was considered a morning peak anymore? Early in COVID-19’s disruption, Dunkin’ executives said commuters shifted to mid-day, typically between 11 a.m. to 2 p.m. And the chain responded with snacking options (carrying an attachment rate of 95 percent-plus) and more cold drinks, like Refreshers.
According to The NPD Group, cold brew coffee servings ordered at quick-serves rose 27 percent in the 12 months ending April 2022, year-over-year. Or some 373 million servings. Offerings of frozen/slushy coffees lifted 3 percent and iced coffee climbed 11 percent to 2.8 billion.
As of Q2, handcrafted cold beverages comprised roughly 80 percent of Starbucks’ sales. Cold coffee and tea mix about 70 percent of The Coffee Bean & Tea Leaf’s business. It’s north of 58 percent at Bad Ass Coffee and 70–80 percent of Dutch Bros.’ take.
While not a COVID-invented trend, the prevalence of remote work did influence the shift. Cold travels better and offers versatility—a reward in the afternoon versus just grabbing a caffeine boost on the way to the office.
And espresso’s rise plays a role as well. Looking at it through a demographic lens, former Dunkin’ CEO David Hoffmann once described espresso as the natural progression of beverage consumption for a coming generation. The transitional role drip coffee once played for soda-drinking consumers as they matured? That’s what espresso represented to a fresh wave of guests. Call it the gateway coffee choice for millennials and Gen Zers.
In terms of how it fits with cold specifically, today’s coffee customer grew up around java shops, which are now ubiquitous on a national, as well as local, cafe level. People are accustomed to ordering blended, non-alcoholic drinks before they even start making spending decisions. They accompanied their parents and jumped to the cold menuboard.
Hot beverages remain popular in the mornings, but guests (often the same customer) can return for a bounce back cold drink in the afternoon. Cold also allows coffee to become a recharge beverage consumed across the day.
According to mobile location analytics platform Placer.ai, the coffee and bakery space outperformed the broader industry in 2021. “Perhaps the ease of grabbing a cup to go, or coffee shops’ position as a ‘third place’ serving hybrid and work-from-home consumers helped boost these venue’s foot traffic,” the company said.
But now there’s a fresh turn in the segment’s path, and the price elasticity, add-on potential, innovation, and overall demand of cold drinks is only going to become more vital as chains work to inspire repeat business and provide value beyond a dollar point. Restaurant menu prices rocketed to a new four-decade high (a common distinction throughout this year) in June, per federal data shared Wednesday. Food away from home bumped 0.9 percent and 7.7 percent versus last year—a figure last matched in 1981. Full-service menu prices are up 8.9 percent over the past year. Limited service is 7.4 percent higher.
Meanwhile, food-at-home prices climbed 12.2 percent, which marked the biggest year-long increase since April 1979.
The fact grocery prices are hiking at an even steeper clip has helped restaurants stabilize traffic a bit in recent months. According to Revenue Management Solutions, quick-service traffic declined 5.4 percent in Q2 compared to last year. Yet as the graph below shows, the line flattened. Traffic trends are down 4 percent year-over-year in June 2022, a slight improvement from the negative 4.1 percent witnessed in May, and a solid uptick from the year’s lowest figure of negative 9.4 percent in April.

Pricing activity appears to be leveling off, too. While average price jumped significantly from a 6.8 percent increase, year-over-year, in Q4 2021 to 10.3 percent in Q1 2022, this past quarter saw only a slight bump, to 10.8 percent.

The quick-service category’s net sales 1.4 percent better, year-over-year. In Q2, average check was up 7.2 percent versus the prior-year stretch. As it has throughout the calendar, higher prices are the main culprit for outsized sales performance. Average net price is up 10.8 percent.
From an RMS consumer study, nearly one in two respondents said they were managing costs by ordering less from restaurants—a trend reflected in sliding basket size, which is down 3.2 percent, year-over-year.


So how does this all affect coffee? According to Placer.ai, recent economic challenges do appear to be slowing patterns.
When comparing foot traffic to a January 2020 baseline, coffee visits outpaced quick-service visits every month between July 2020 and May 2022. But that changed in June. “… a combination of inflation, high gas prices, and the rise in COVID cases kept some consumers away,” the company suggests. “But given the trends of the past two years there is every reason to believe that the June 2022 visit numbers are a reflection of the temporary challenges and not of any drop in coffee demand.”
Looking further at Starbucks and Dunkin’, foot traffic trends remain consistent with visit patterns for the wider category. They didn’t change much between March and May before dipping in June. Starbucks and Dunkin’ saw a year-over-year decline in monthly visits of 7.8 and 4.1 percent, respectively, Placer.ai data showed. Year-over-three-year comparisons revealed Dunkin’ maintained its June 2019 visit levels while Starbucks’ foot traffic fell 6.6 percent.
The discrepancy in year-over-year versus year-over-three-year results, the company noted, owes to Dunkin’ recovering quicker than Starbucks in 2021, meaning the former had further to fall on a year-over-year basis. And the three-year view could signal Dunkin’s more value-conscious approach is helping it weather current storms.
“It is also important to note that Starbucks’ Yo3Y visit gap and Starbucks’ and Dunkin’s YoY visit gaps in June 2022 are not particularly large and follow three months of both brands staying relatively close to both 2019 and 2021 levels,” Placer.ai said. “This could indicate that the June performance reflects consumers’ temporary adjustment to the current economic situation, and the long-term positioning of both brands remains strong.”
On the top line, Dunkin’s 2021 same-store sales rose 15.5 percent and 10.4 percent on a two-year stack. Starbucks’ North America and U.S. comps increased 12 percent in its most recent report (Q2), driven by a 7 percent boost in average ticket and a 5 percent lift in transactions. The chain’s average ticket reached an all-time high in Q2.
Placer.ai also examined Dutch Bros., a 540-unit chain building on its first year as a public brand. The company opened a record-breaking 98 stores systemwide during that run, including in new states Texas, Oklahoma, and Kansas. Thirty-five of those came in just Q4 (23 in December). Dutch Bros., which expects to open at least 125 stores this fiscal calendar, generated same-store sales gains of 8.4 percent, year-over-year, in 2021, or 10.3 percent across two years.
Visits have continued to rise, per Placer.ai., even as Dunkin’ and Starbucks battle volatility. In June, the concept saw a 22.8 and 178.2 percent rise in its year-over-year and year-over-three-year foot traffic, respectively. But year-over-year visits-per-venue levels have mostly evened out, with June numbers down 0.4 percent. An indication, Placer.ai said, growth is coming from expansion.

Overall visits, though, are not the only foot traffic metrics climbing for Dutch Bros. The brand’s average trade area (how far 70 percent of guests are traveling to reach a location—has steadily grown over the past four years. It’s stretched from 36.9 square miles in Q2 2019 to 54.5 square miles in Q2 2022. Between Q2 2021 and Q2 2022, Dutch Bros.’ trade area lifted by 13.3 percent, “even though the increase in gas prices and wane of COVID meant that consumers had fewer reasons to visit drive-thrus—and especially far from home spots—compared to 2021,” Placer.ai said

