In regards to perception, it appears a COVID-19 switch has flipped. The CDC’s May 13 announcement that vaccinated individuals could gather, indoors or outdoors, has triggered a watershed moment in the pandemic’s 15-month journey.
For the first time since Datassential began tracking consumer sentiment over a year ago, more people are concerned about the economic crisis caused by coronavirus today than the public-health crisis (51 versus 49 percent). And, fittingly, consumers have noticed signs of the industry’s labor shortage and indicators of inflation, such as higher menu prices.
READ MORE:
The Digital Restaurant Customer Isn’t Going Anywhere
Why the Hiring Crisis is a Moment of Reckoning for Restaurants
An early June report from the National Restaurant Association shed some light on what’s taking shape today from a labor angle as guest sentiment finally turns the corner. The issue at hand for operators has shifted from convincing guests it’s safe to eat out again, to staffing up to meet that rush.
But, like so many aspects of COVID, it’s not a broad-stroke issue. Restaurant employment rose for the fifth consecutive month in May, yet staffing levels remain well below pre-crisis levels. Eating and drinking places added a net 186,000 jobs in May on a seasonally adjusted basis, according to the Bureau of Labor Statistics. Over the past five months, the category tacked on 830,000 net jobs. Or the equivalent of the total restaurant jobs added in the 43 months prior to the pandemic.
Overall, eating and drinking places remain 1.5 million jobs (12 percent) short.
While unemployment trended higher across each of the major restaurant segments in recent months, total payroll counts are still below pre-COVID marks. And here’s where the divergence occurs: Between April 2020 and April 2021, full-service brands added nearly 2.8 million jobs. The result is a full 750,000 positions (14 percent) below typical figures.
Limited-service restaurants, however, as of April, were down just 143,000 jobs (3 percent). Staffing at snack and non-alcoholic beverage bars (like coffee and ice cream shops) are 28,000 jobs (4 percent) under February 2020 levels.
Employee counts in the cafeterias/grill buffets/buffets segment (–58 percent); foodservice contractor (–37 percent); catering and mobile foodservice (–32 percent); and bars and taverns (–25 percent) are all significantly depressed from normal staffing.
The data backs two points being broadcast from the restaurant trenches—the labor challenge is pressing down like an anvil, and quick-serves are recovering faster than sit-down counterparts, as has been the case throughout and from day one of COVID.
Broadly, 84 percent of operators said staffing levels are lower than normal, according to an Association study fielded in early April. Forty-seven percent said they were more than 20 percent below pre-virus marks.
Only one in 10 full-service operators said their restaurant was at or above normal staffing in April. A majority of them were more than 20 percent below.
Reflective of the BLS data, 32 percent of coffee and snack operators and one in five quick-service and fast-casual operators said employee counts were at or above normal levels in April.
Among restaurant operators currently below, 28 percent said they think it will be seven to 12 months before staffing returns to normal. Twenty percent believe it will take more than a year, while 10 percent say staffing levels will never bounce back to where they were.
A majority of full-service, quick-service, and fast-casual operators noted it would take at least six months.
At the beginning of the year, just 8 percent of restaurant operators rated recruitment and retention of employees as their top challenge, according to Hudson Riehle, senior vice president of research at the Association. By April, that number rose to 57 percent.
Clearly, it’s on the collective minds of restaurants. And the US Chamber of Commerce supported the sector’s long-term concerns. It released a report Tuesday that said America’s labor shortage is holding back its economic recovery. The report said there were 8.1 million vacant job openings in the U.S.—a record high—in March 2021, the latest month for which data was available. That’s up more than 600,000 from February.
From another angle, there are roughly half as many available workers for every open job (1.4 available workers/opening) across the country as there have been on average over the past 20 years (2.8 historical average).
Additionally, in several states and several industries, including hard-hit sectors like education and health services as well as professional and business services, there are currently fewer available workers than the total number of jobs open.
Businesses only created 266,000 jobs in April when some analysts expected more than 1 million.
The number of job openings across the U.S. reached a record-high 9.3 million on the final business day of April, according to BLS. It was the highest amount since the BLS’ monthly Job Openings and Labor Turnover Survey began in December 2000. The previous record occurred in March, when there were 8.1 million openings. The industry with the largest increase in April was accommodation and food services, which saw its job pool widen by 349,000, or from 989,000 to 1.3 million. Its open rate also rose from 7.7 to 9.9 percent.

Meanwhile, the amount of hires hardly moved at 6.1 million and the hires rate remained unchanged at 4.2 percent. The number of individuals quitting jobs and the quitting rate in April both rose to record highs of 4 million and 2.7 percent, respectively.
So to sum it up, the labor challenge, while nuanced and varied by segment, market, and more, isn’t dissipating. It may get a lift soon as half of the country’s states are set to end the $300 weekly expanded unemployment boost as early as June 12 and as late as July 19—both months ahead of the September 6 expiration date.
Yet still, parallel issues will continue to complicate the road back.
Shake Shack founder and USHG head Danny Meyer recently said it could “at least two or three months” for supply and demand to keep up with each other and hit an equilibrium, in terms of labor and customers dining out. Meyer, the chair of the NYC Economic Development Corporation, said, “Everybody is hiring at the exact same time,” according to Business Insider.
But he also credited the setback to the notion “many of our workers have left the city.” People who couldn’t afford urban real estate without usual wages during COVID. Or the fact many laid-off staff fled restaurants for other industries “that were actually doing quite well during COVID.”
Will they return to hospitality? Difficult to say. But it becomes easier to see why brands like Chipotle recently upped wages. The recruitment battle has changed, and broadened.
“In our company, what we know is, when we educate people on the purpose, the growth and then we show up with a compelling starting wage, that leads them to ultimately a), I would say, a great career wage, meaning you can get to $100,000 plus and really short order a couple of years. That resonates with people,” CEO Brian Niccol recently said at the Piper Sandler Consumer Marketplace Conference.
“… But you’ve got to be sharp, I mean, you’ve got to be on it,” he added. “You’ve got to be after it. And then you’ve got to also make sure that you put your arms around the people that you currently have, because you don’t want to be losing them either.”
Customers are paying attention. According to Datassential, 54 percent of people noticed restaurants struggling to serve customers due to a lack of employees—the highest figure among the sectors listed.
Grocery stores (45 percent), retail (36 percent), gas stations/C-stores (30 percent), department stores (25 percent), drug stores/pharmacies (24 percent), hotels (23 percent), and childcare centers (19 percent) followed.
“Consumers who have noticed ‘help wanted’ signs and rushed service from a skeleton crew are willing to give a restaurant or hotel the benefit of the doubt, but to a lesser degree than retail stores or supermarkets,” Datassential said. “People have higher expectations for true hospitality at foodservice and lodging venues.”
However, those two segments also received the most customer willingness to change how they order, like getting a restaurant meal delivered or opting for the drive-thru instead of waiting in a staff-light dining room.
“How have staffing interruptions changed your likelihood to visit those places?”
Grocery stores
- Willing to visit again: 74 percent
- Change how you order: 24 percent
- Not willing to visit that place again: 3 percent
Department stores
- Willing to visit again: 73 percent
- Change how you order: 23 percent
- Not willing to visit that place again: 3 percent
Gas stations/C-stores
- Willing to visit again: 73 percent
- Change how you order: 26 percent
- Not willing to visit that place again: 1 percent
Retail stores
- Willing to visit again: 69 percent
- Change how you order: 28 percent
- Not willing to visit that place again: 3 percent
Drug stores/pharmacies
- Willing to visit again: 68 percent
- Change how you order: 27 percent
- Not willing to visit that place again: 4 percent
Restaurants
- Willing to visit again: 64 percent
- Change how you order: 31 percent
- Not willing to visit that place again: 5 percent
Hotels
- Willing to visit again: 60 percent
- Change how you order: 30 percent
- Not willing to visit that place again: 10 percent
Speaking of Chipotle, the brand also recently announced it would hike prices 3.5–4 percent to cover the cost of raising wages for employees.
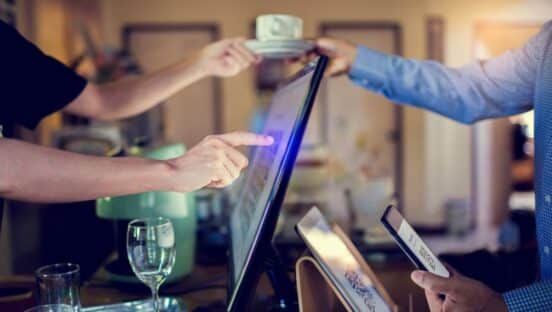
While there is some room to follow suit, Datassential said, operators should also consider automation. Half of consumers said they could accept ordering kiosks and other tech. Nearly as many would stomach slight price increases to help restaurants get to full strength.
“What level of menu price increase would you happily accept and regularly pay, if it ensured that a restaurant could retain the optimal number of employees?
- Less than 2.5 percent: 22 percent
- Less than 5 percent: 27 percent
- Less than 7.5 percent: 15 percent
- Less than 10 percent: 18 percent
- Less than 12.5 percent: 2 percent
- Less than 15 percent: 4 percent
- Less than 17.5 percent: 3 percent
- Less than or equal to 20 percent: 6 percent
- Greater than 20 percent: 2 percent
On one particular labor topic, consumers and operators seem aligned. Half believe enhanced unemployment is contributing to the labor shortage. About two in five also argued restaurants don’t pay enough.
“Why do you think some restaurants are having trouble finding and hiring enough employees at this stage of the pandemic?”
- Enhanced unemployment benefits create a disincentive to work: 52 percent
- Wages in foodservice are not high enough to attract employees: 39 percent
- People don’t want service jobs that risk exposure to COVID-19: 38 percent
- The pandemic is still causing health problems for workers: 36 percent
- Parents won’t let their children work while during the pandemic: 28 percent
- People are dropping out of the workforce to care for family: 28 percent
- People are starting to find jobs in other industries: 27 percent
- Potential employees can make more money in the gig economy: 24 percent
When asked if guests are seeing signs of inflation and rising prices in general in the economy, 82 percent said they did. And this could signal trouble for restaurants, with 35 percent of consumers saying they’d cut back on restaurant meals if inflation accelerated.

Inside the customer’s current state of mind
The dining landscape has definitely changed. Datassential asked respondents, over the next few months, where would they NOT WEAR A MASK, where would they WEAR A MASK, and where would they WEAR A MASK UNPROMPTED.
Half of consumers, according to the results, don’t have to be told to wear a mask when dining at a restaurant. And most remaining potential guests would agree to wear one if waitstaff required. People who want to get vaccinated but have not done so yet were significantly more likely than others to wear masks unprompted when dining out or doing any other activity outside their homes.
Walking outside
- Not wear a mask: 53 percent
- Wear a mask unprompted: 47 percent
Meeting a group
- Not wear a mask: 14 percent
- Wear a mask if required: 33 percent
- Wear a mask unprompted: 53 percent
Eating at a restaurant
- Not wear a mask: 13 percent
- Wear a mask if required: 37 percent
- Wear a mask unprompted: 50 percent
Going out for entertainment
- Not wear a mask: 12 percent
- Wear a mask if required: 30 percent
- Wear a mask unprompted: 57 percent
Going to work/school in person
- Not wear a mask: 11 percent
- Wear a mask if required: 32 percent
- Wear a mask unprompted: 56 percent
Shopping in a retail store
- Not wear a mask: 11 percent
- Wear a mask if required: 33 percent
- Wear a mask unprompted: 56 percent
Shopping in a grocery store
- Not wear a mask: 10 percent
- Wear a mask if required: 32 percent
- Wear a mask unprompted: 58 percent
Going to an airport/flying
- Not wear a mask: 9 percent
- Wear a mask if required: 28 percent
- Wear a mask unprompted: 63 percent
Going to a doctor’s office/hospital
- Not wear a mask: 9 percent
- Wear a mask if required: 32 percent
- Wear a mask unprompted: 59 percent
When it came to employees wearing masks, there was essentially zero consensus.
“How long should restaurant servers and other people with customer service jobs wear masks, regardless of whether they’re vaccinated against COVID-19?”
- 30 percent: It’s already safe for them to stop wearing masks
- 22 percent: Another three months
- 20 percent: Customer-facing employees should always wear a mask
- 20 percent: Through the end of 2021
- 9 percent: Into 2022 or later
However, and in line with another consistent pandemic theme, guests said they trust waitstaff more than fellow customers.
“If you go out to eat at a restaurant, which would concern you more?”
- 53 percent: If other guests were not wearing masks
- 47 percent: If servers were not wearing masks
“What do you think is the purpose of wearing a mask during this time of coronavirus?”
- 45 percent: Wearing masks protects others
- 41 percent: Wearing masks protects the people who wear them
- 14 percent: Masks serve no purpose (this was significantly higher among “vaccine rejectors” at 49 percent)
One thing that hasn’t changed—cleanliness leads all factors that affect where consumers choose to eat these days.
- Clean and sanitary: 61 percent (72 percent for Boomers)
- Good service: 51 percent
- Great taste: 49 percent
- Health: 47 percent
- Value: 43 percent
- Nearby: 38 percent
- Supporting local restaurants: 32 percent
- Locally owned: 29 percent
- Speed: 26 percent
- Variety: 25 percent
This past winter served as the high-water mark for consumers’ trepidation of busy venues, like sports bars and buffets. These feelings have moderated.
“As it relates to contracting COVID, how risky do you consider each of the following activities?” (mid-May)
Going to a nightclub
- Not risky: 16 percent
- Too risky: 52 percent
- Change from January: –22 percent
Going to a buffet-style restaurant
- Not risky: 19 percent
- Too risky: 41 percent
- Change from January: –16 percent
Having drinks at a bar/pub/sports bar
- Not risky: 20 percent
- Too risky: 39 percent
- Change from January: –23 percent
Using a salad bar or soup bar
- Not risky: 20 percent
- Too risky: 39 percent
- Change from January: –11 percent
Using a cafeteria-style serving line
- Not risky: 23 percent
- Too risky: 33 percent
- Change from January: –8 percent
Dining inside at a fast-food restaurant
- Not risky: 24 percent
- Too risky: 30 percent
- Change from January: –11 percent
Dining inside at a sit-down restaurant
- Not risky: 24 percent
- Too risky: 29 percent
- Change from January: –12 percent
Ordering food assembled in front of you
- Not risky: 34 percent
- Too risky: 20 percent
- Change from January: –2 percent
Ordering prepared foods from grocery or C-store
- Not risky: 38 percent
- Too risky: 19 percent
- Change from January: –7 percent
Dining at a restaurant’s patio/outdoor-seating area
- Not risky: 42 percent
- Too risky: 17 percent
- Change from January: –4 percent
Getting food from restaurants delivered
- Not risky: 46 percent
- Too risky: 15 percent
- Change from January: 4 percent
Getting carryout/takeout from restaurants
- Not risky: 49 percent
- Too risky: 14 percent
- Change from January: 3 percent
Conspicuous cleaning practices have reverted to early pandemic levels, too. This aligns with the simple reality people are dining out again. Just as they were looking for reassurance when the crisis was fresh, they’re searching for affirmation today as they take the leap.
The one exception is the demand to see employees wearing masks and other PPP, which is up from the 55 percent of consumers who called it a must-have in March 2020.
“If dining rooms reopen, what could restaurants do to make you feel safer dining in?”
Percentage of consumers indicating each option is a “requirement.”
Regularly/visibly wiping down tables, kiosks, other things people touch
- May 18: 68 percent
- January 28: 81 percent
- Difference: –13 percent
Employees wearing food safety gear (masks, gloves, hairnets, etc.)
- May 18: 65 percent
- January 28: 78 percent
- Difference: –13 percent
Adding more food covers, sneeze guards, enclosed cold cases, etc.
- May 18: 55 percent
- January 28: 70 percent
- Difference: –15 percent
Adding more space between tables/eliminating communal seating
- May 18: 52 percent
- January 28: 67 percent
- Difference: –15 percent
Visibly posting results/grades from food safety inspections
- May 18: 51 percent
- January 28: 54 percent
- Difference: –3 percent
Providing disinfectant wipes for me to use
- May 18: 49 percent
- January 28: 58 percent
- Difference: –9 percent
No open containers of food
- May 18: 49 percent
- January 28: 55 percent
- Difference: –6 percent
Serving everything individually wrapped
- May 18: 41 percent
- January 28: 42 percent
- Difference: –1 percent
Enabling mobile ordering/contactless payment
- May 18: 40 percent
- January 28: 45 percent
- Difference: –5 percent
Propping open doors so customers don’t have to touch door handles
- May 18: 36 percent
- January 28: 40 percent
- Difference: –4percent
All that noted, consumers do want the classic restaurant experience.
“As the country looks to ‘get back to normal,’ what do you want most restaurants to provide?”
- 30 percent: Familiar, favorite menu items better than I could ever prepare at home
- 21 percent: Service and hospitality I could not recreate by myself at home
- 20 percent: An environment for connecting with others that video conferencing couldn’t replicate
- 14 percent: Innovative menu items only restaurant professions could think up and prepare
- 14 percent: Over-the-top entertainment